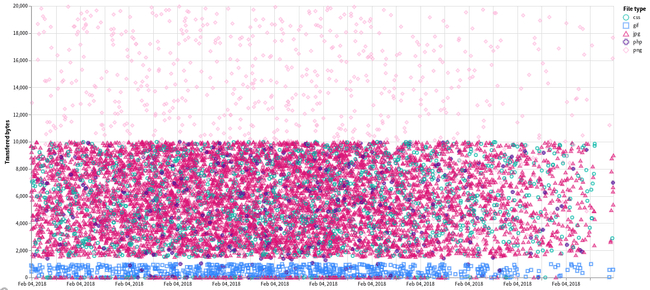
Scatterplot in Kibana using Vega
This tutorial explains how to create a scatterplot via Vega visualization which are available as an experimental visualization since Kibana 6.2. If you want to use it prior to 6.2 look into Yuri’s Vega plugin.
Via Vega visualizations you can use the Vega (or in this case Vega-Lite) visualization grammar to write and visualize data in Kibana. The syntax itself is meant for more advanced users, but offer some possibilities, that have not been able to visualize beforehand.
In this short tutorial we will create a scatterplot, that draws individual documents in Elasticsearch into a graph as points.
Let’s assume we have documents that contain at least the following fields stored in logstash-* indexes:
{
  "@timestamp": "2018-02-01T18:05:55.363Z",
  "bytes": 2602,
  "extension": "jpg"
}
We would now like to draw a scatterplot, that uses the time of each document on the x-axis and the amount of transferred bytes on the y-axis. Besides that we also want to give each extension a custom color and shape of point. The resulting scatterplot could look like as follows:
To produce that kind of scatterplot, you can use the following Vega source. An in depth explanation can be found in the inline comments:
{
  // We use Vega-Lite syntax here instead of Vega. The Vega visualization
  // supports both and we can specify which one we want to use by specifying
  // the corresponding schema here.
  $schema: "https://vega.github.io/schema/vega-lite/v2.json"
  // Use points for drawing to actually create a scatterplot
  mark: point
  // Specify where to load data from
  data: {
    // By using an object to the url parameter we will
    // construct an Elasticsearch query
    url: {
      // Context == true means filters of the dashboard will be taken into account
      %context%: true
      // Specify on which field the time picker should operate
      %timefield%: @timestamp
      // Specify the index pattern to load data from
      index: logstash-*
      // This body will be send to Elasticsearch's _search endpoint
      // You can use everything the ES Query DSL supports here
      body: {
        // Set the size to load 10000 documents
        size: 10000,
        // Just ask for the fields we actually need for visualization
        _source: ['@timestamp', 'bytes', 'extension']
      }
    }
    // Tell Vega, that the array of data will be inside hits.hits of the response
    // since the result returned from Elasticsearch fill have a format like:
    // {
    //   hits: {
    //     total: 42000,
    //     max_score: 2,
    //     hits: [
    //       < our individual documents >
    //     ]
    //   }
    // }
    format: { property: "hits.hits" }
  }
  // You can do transformation and calculation of the data before drawing it
  transform: [
    // Since @timestamp is a string value, we need to convert it to a unix timestamp
    // so that Vega can work on it properly.
    {
      // Convert _source.@timestamp field to a date
      calculate: "toDate(datum._source['@timestamp'])"
      // Store the result in a field named "time" in the object
      as: "time"
    }
  ]
  // Specify what data will be drawn on which axis
  encoding: {
    x: {
      // Draw the time field on the x-axis in temporal mode (i.e. as a time axis)
      field: time
      type: temporal
      // Hide the axis label for the x-axis
      axis: { title: false }
    }
    y: {
      // Draw the bytes of each document on the y-axis
      field: _source.bytes
      // Mark the y-axis as quantitative
      type: quantitative
      // Specify the label for this axis
      axis: { title: "Transferred bytes" }
    }
    color: {
      // Make the color of each point depend on the _source.extension field
      field: _source.extension
      // Treat different values as completely unrelated values to each other.
      // You could switch this to quantitative if you have a numeric field and
      // want to create a color scale from one color to another depending on that
      // field's value.
      type: nominal
      // Rename the legend title so it won't just state: "_source.extension"
      legend: { title: 'File type' }
    }
    shape: {
      // Also make the shape of each point dependent on the extension.
      field: _source.extension
      type: nominal
    }
  }
}